by Sean B.
Covid-19, in simple terms Coronavirus is the trendy topic currently in the world. Its devastating effect on the global stage is terrifying.
Contents
Shutting down business, sport leagues, air travels and everything. Except the Health sector and other essential services sector that will help contain the spread. It keeps ravaging every countries across the globe causing destruction along the way. And tracking the spread has become an easy task for anyone interested . You can easily follow up the progress in each country, continent as it ravages on. If you are one of those interested individuals in finding out about the spread. This is the article for you, and you should keep on reading on.
This article has listed some of the best useful maps that you can find online. These maps will help you find out current events about the spread of COVID-19. We have lots of maps, apps and dashboards that have helped individuals around the world to track the spread of the virus. But this list contains very reputable and highly sourced data apps and maps. We don't need the number of Covidiots increasing, spreading false information and rumour across the planet. So the following below are the best apps to make use of as an internet user.
Note : Before we start mentioning the apps and maps. You need to get this important information. You have to be wary of various numbers of fake and illegal maps and dashboards. They will look like a replica of the original, they are usually designed to attack your system with virus and other malicious softwares.
Well we have several COVID-19 maps and dashboards from highly reputable sources, bit a while lot of them make use of data from JHU. That is, John Hopkins University's Center for System Science and Engineering.
So what are the best dashboards and maps to make use of
Well, Click on the link below, as they make use of dashboards directly from their website organization. Make sure you check the website well enough, to avoid visiting a replica site. Never download anything that looks strange, even when asked to download. All these, is to avoid being hacked by malicious softwares devised by hackers. A lot of the maps and dashboards we will talk about comes from this map. But they offer their own map, that is precise accurate and well detailed.
The John Hopkins University's Corona Virus dashboard usually displays a lot of useful information. Information like, the number of cases, location where the cases are found and as well as the total number of death and recoveries found in each location. On the dashboard, you can zoom in on any location of your choice. Scroll through different regions in an area. To view any information like number of cases by country, by region, by city or by state simply cluck on a the red dot. This map comes in PC and Mobile version, so that you can monitor the coronavirus map on your mobile phone anywhere and at anytime.
Why was this map created ?. According to sources in the university, the dashboard was designed to provide researchers, general public and public health practitioners. It is well designed and easy to access. It is user friendly and it is an adequate tool used to track the outbreak of the corona virus as its ravages on.
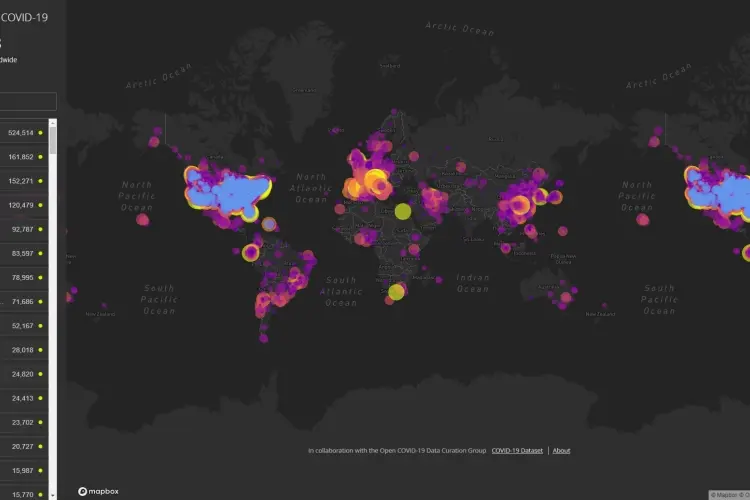
Are you looking for a fun looking map, that is cartoon like in nature?. Then this map or dashboard is the one for you. It is one of the most attractive looking dashboard or map on the net. It even has one feature that makes it different from others, it has dark mode. They get all their data from different and original sources, which makes it one of the best and sought after maps. It animated the ways the virus spread all the way from the very first reported cases in Wuhan.
Well, if you are not fan one the dark mode feature, you love everything brightly colored. Then, you should look at the WHO dashboard. Their own dashboards and maps, is cheerful and colorful in nature.
While using HealthMap covid-19 dashboard, you are bound to enjoy a slick and user friendly design. With some cool looking animations, which you the user can set if you wish . These animation displays the spread of the virus across the globe in an animated format. All cases starting from the very first reported case.
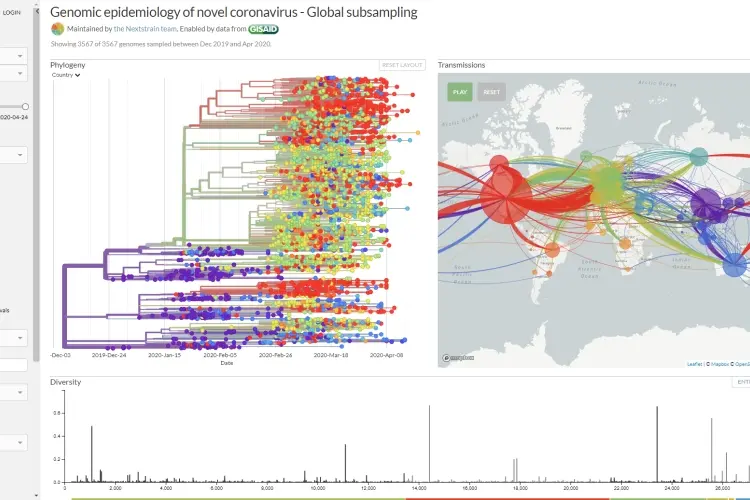
Well, this map and dashboard is quite different from others listed above. It is technical, and contains little information about the rampaging speed of the disease. But the map/dashboard is pretty much informative to any user who wishes to use it. It gives a detailed analysis of the virus, and the routes at which the virus travels from one nation to another. It's a fascinating map/dashboard that has a slick design and a user friendly interface.
As we have said, it's technical but still easy to understand. It provides some explicit detailed information and provides the routes of the virus in animated format. That is, the way it spreads from one area to another area, region to region, and country to country.
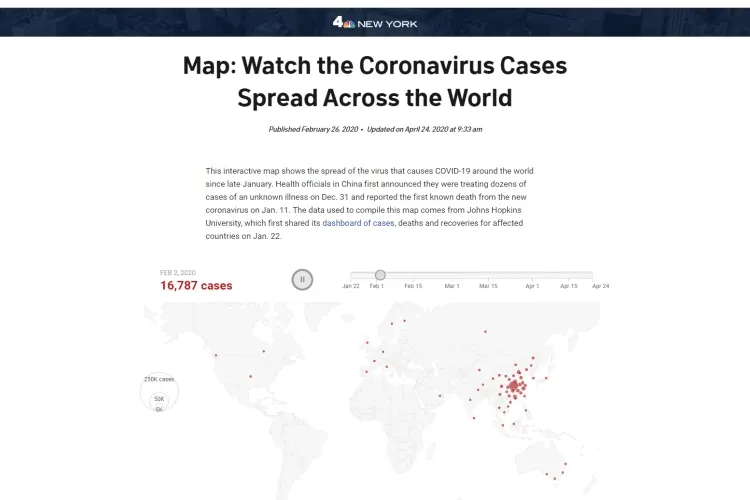
This is a map/dashboard from the NBC New York show. They show the route and areas at which the virus spread in the world. Though it might not be as good as the other listed maps and dashboards. But it is easy and simple to understand. It is user friendly and easy to interact with as a user. One feature that makes it standout from others, it is simplicity. They don't use colors but rather bubbles for users with color impairment. So try out this map or dashboard if you love simplicity.
NBC New York 's coronavirus maps and dashboard is based of the John Hopkins University's Center of System Science and Engineering. It also features some nice looking animations to help users with understanding of the spread.
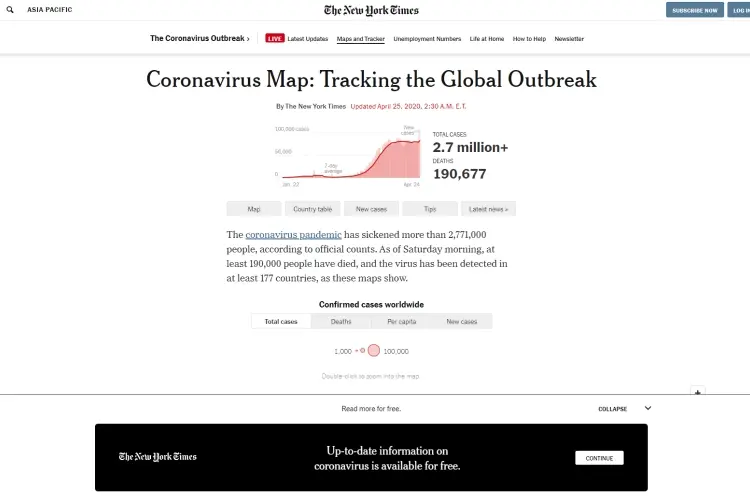
Well, when we talk about the best non-map data around. This is the best dashboard to look for as a user. It is well rounded and easy to understand. It is even the easiest dashboard to understand when we talk about covid-19 dashboards. We have different categories of users online, that's why NYT provides a number of text stats. It describes the current pandemic ravaging the lands in a detailed manner. It has a user friendly interface and a slick design.
One unique feature about this dashboard or map. It is the easy to read charts that is present and the well detailed graphs it presents.
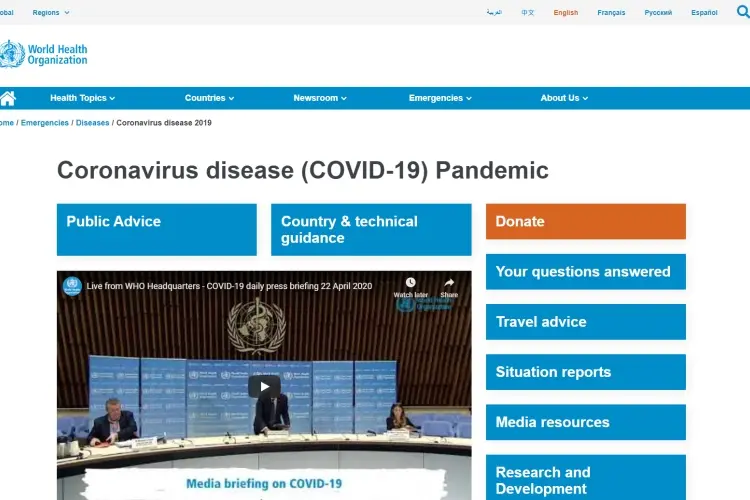
Who else than the very World Health Organization to provide you the most detailed information?. Well, nobody else comes close to them. They are the number one map/dashboard to use when following the virus spread across the globe. They are certified and have one of the most original data present on the net. Other sites makes use of their data, to set up their own dashboards and maps.
To get verified information I will advice you use this map. It has slick design which is easy to access. A user friendly interface for the users.
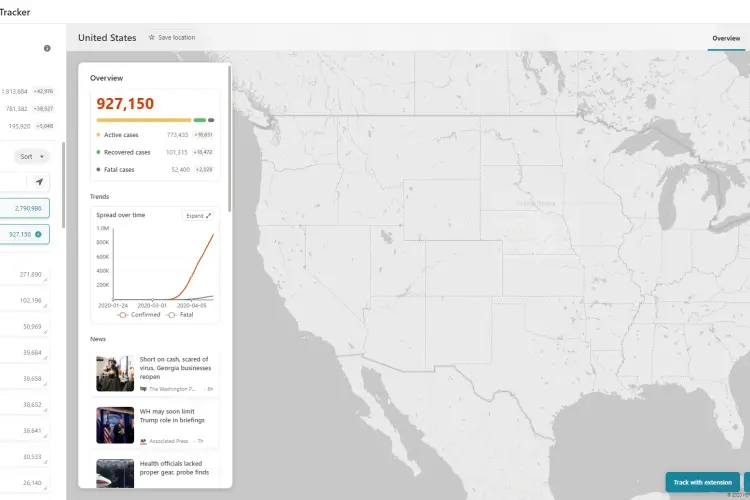
With its slick and impressive user interface. You are sure going to love this map/dashboard. It is quite easy to use and navigate around when using it. Just like all the listed above maps and dashboards, it presents all the cases worldwide per country. It shows the range and spread of the covid-19 pandemic. It shows detailed information about the number of cases, number of recoveries and number of deaths on each region and country.
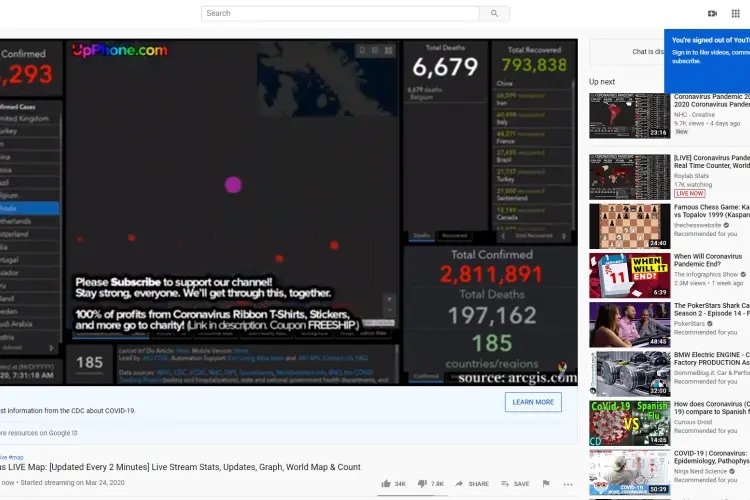
This is a YouTube Channel, that provide historical spread of the virus. It does not provide users with the current live action of the spread. But you can learn more about the past cases and spread of the virus. It gives a detailed information of the virus and its spread.
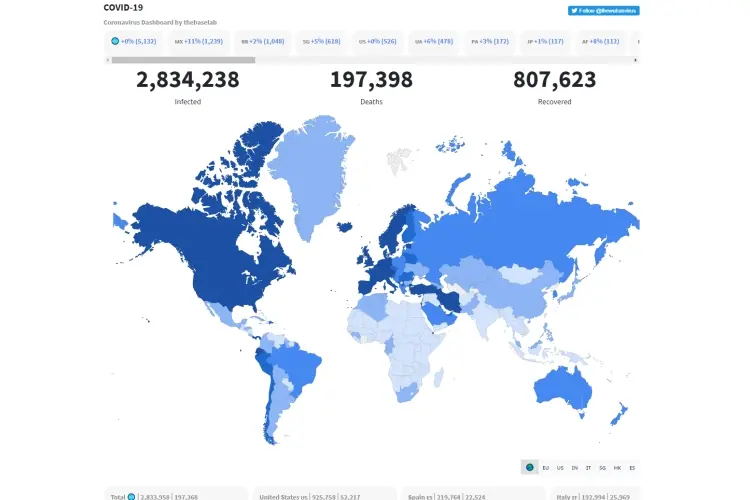
This map shows the spread of the viral infection . They show the infected countries in Red and uninfected countries in white. Same as the regions in varying countries. The site as said by the owner of the site, he updates the site 4times on a daily basis.
So with the above listed maps and dashboards you should have an in depth knowledge about the spread of the virus. You should have this information at your fingertips. With this article I hope you have learnt a lot about the current situation of the world. And remember follow the rules stated by the WHO. Try to stay safe and stay at home. If you show any symptoms of the virus, do not hesitate to visit the nearest Diseases control center. Avoid contact with other individuals to reduce spread. And if you have any case in your area, be extra careful Stay At Home and Stay Safe.

About Sean B.
Sean Bradley is a highly regarded marketing expert with extensive experience and expertise in the field. With a passion for helping businesses thrive and grow, Sean has established himself as a leading figure in the marketing industry. Sean's expertise spans various marketing channels, including digital marketing, social media marketing, search engine optimization (SEO), content marketing, and branding. He is well-versed in utilizing data-driven insights to craft targeted marketing strategies that resonate with audiences and generate measurable ROI.
 |
 |
 |
 |
Recent Post
Let's try FREE Giveaways. Or go to Free Gifts page
Update AdBlock to see the secrets. Hit a button below for update
 |
 |
 |
 |